Comparing Two Point Clouds
Please note that this tool is not freely available for use. Each utilization of the tool requires tokens. You can obtain tokens by purchasing them or accessing your trade management page. For more detailed instructions, refer to this article.
The point cloud comparison allows you to compare one point cloud against another. This tool is particularly useful for:
-
Comparing scans from different dates (progress monitoring)
-
Checking deviations between two survey campaigns
-
Validating re-scans after corrections
-
Detecting structural changes or movements
It is important to remember that achieving a perfect 100% alignment is not realistic. Point clouds may contain noise, density variations, or slight acquisition offsets that can influence the results.
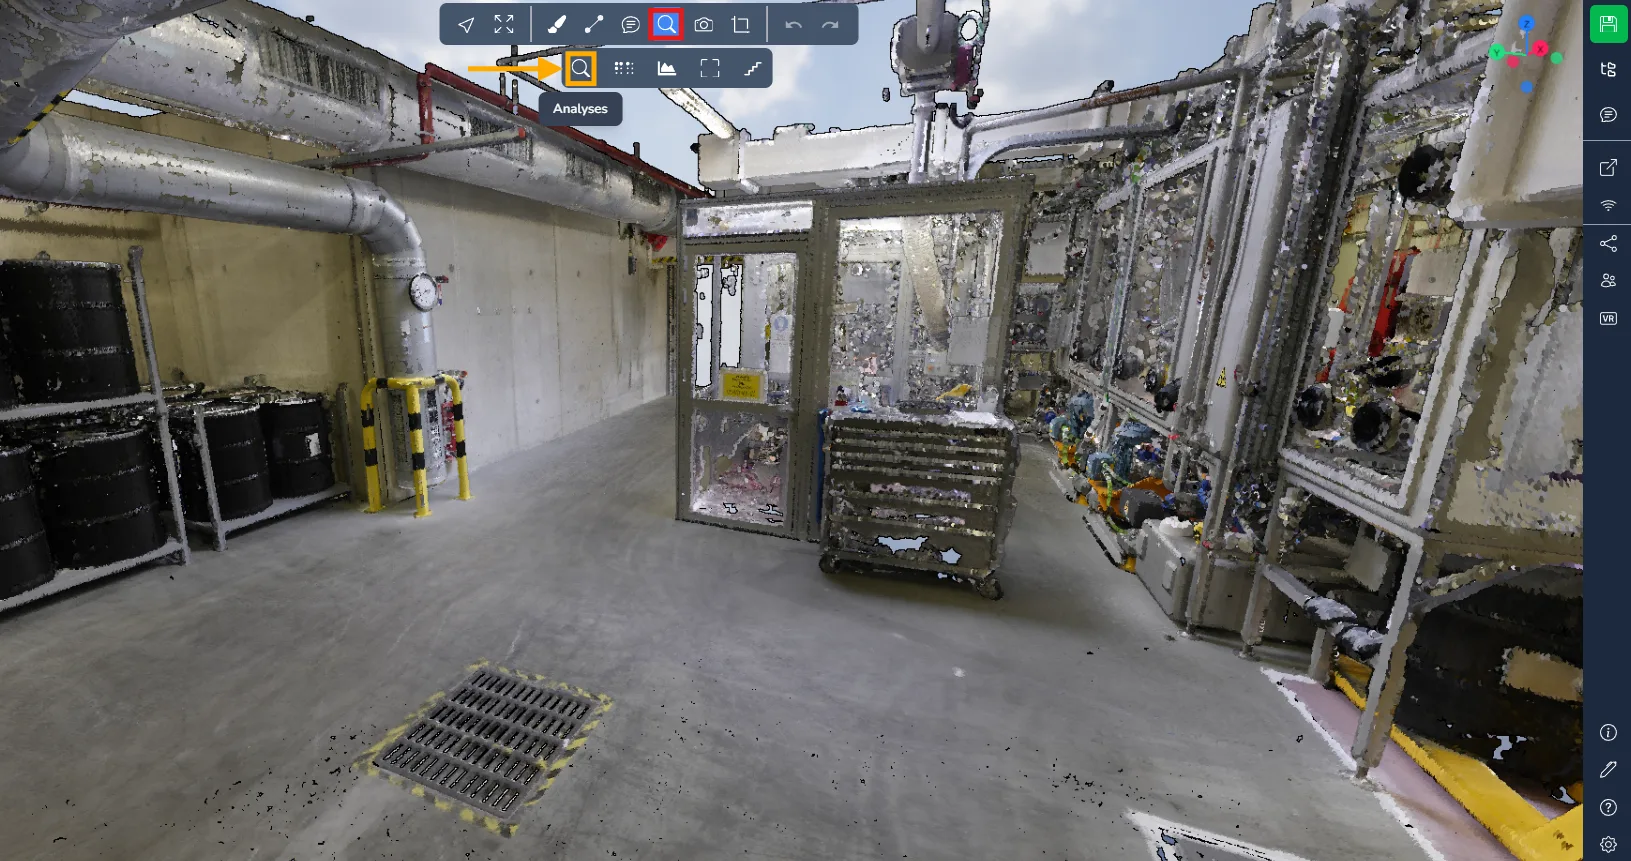
Accessing the Comparison Tool
To access the analysis window, navigate to the Advanced tools menu and select the magnifying glass icon.
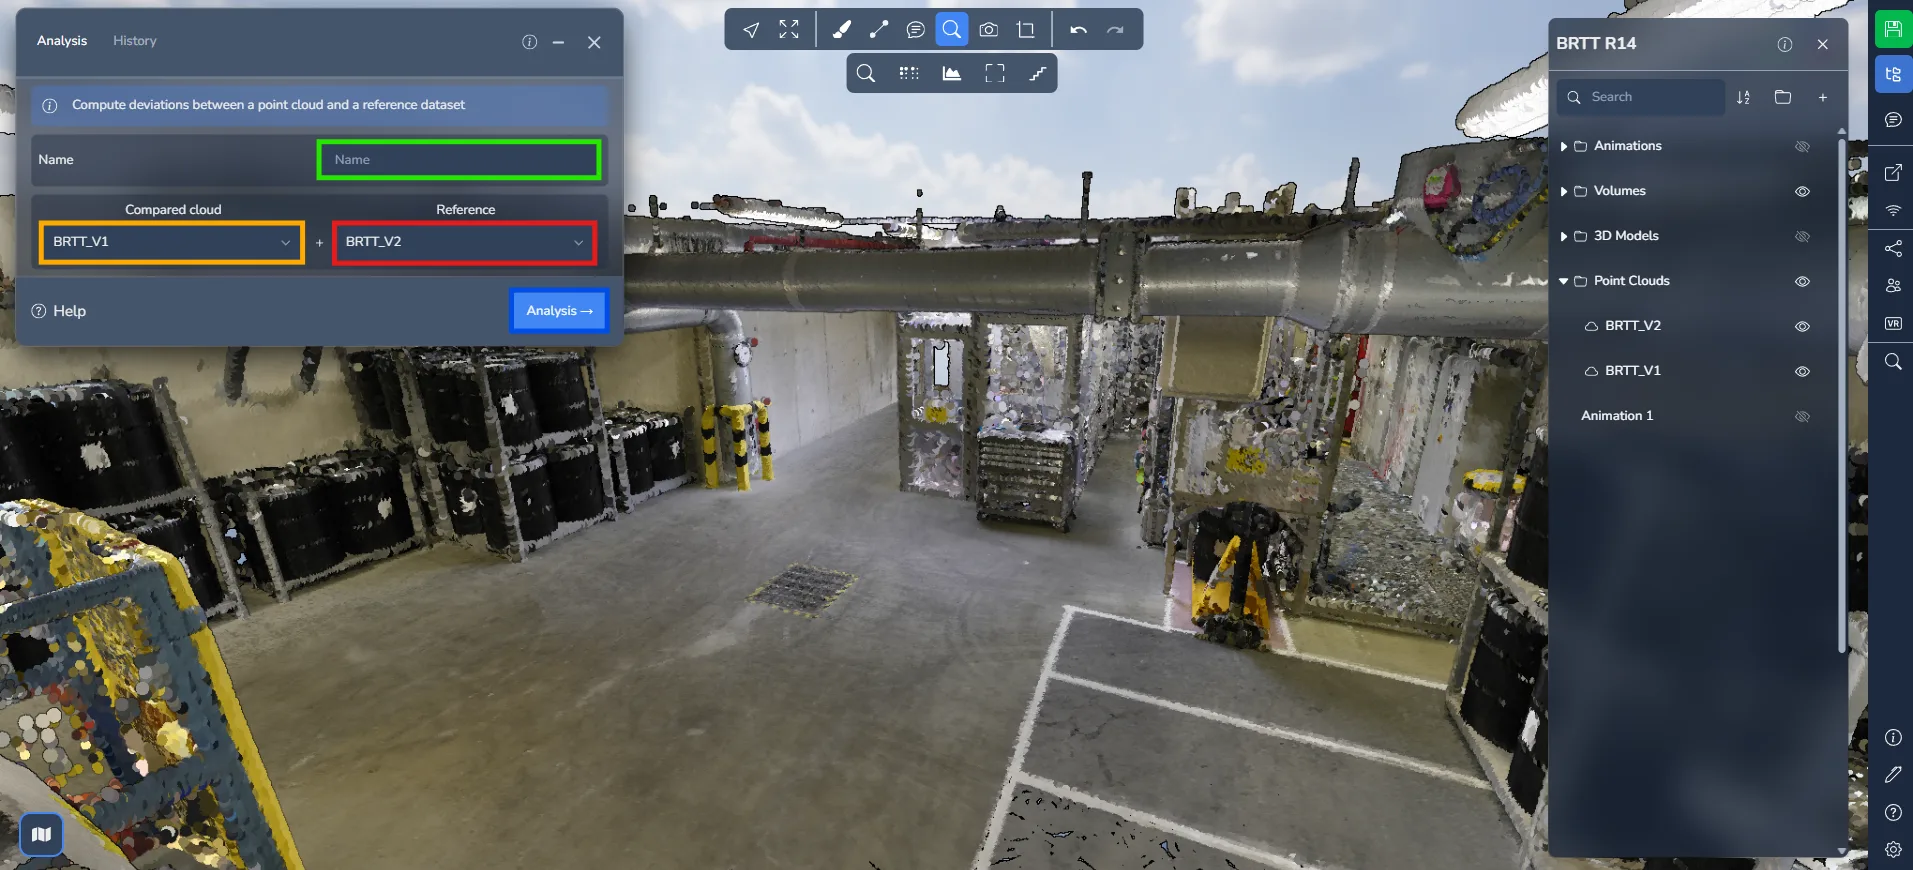
Before launching the process, several parameters must be defined in the analysis window:
-
Assign a name to your comparison. Choose a meaningful name to help identify it later.
-
Select the comparison point cloud.
-
Select the reference point cloud.
Click on "Analysis" to start the comparison process.
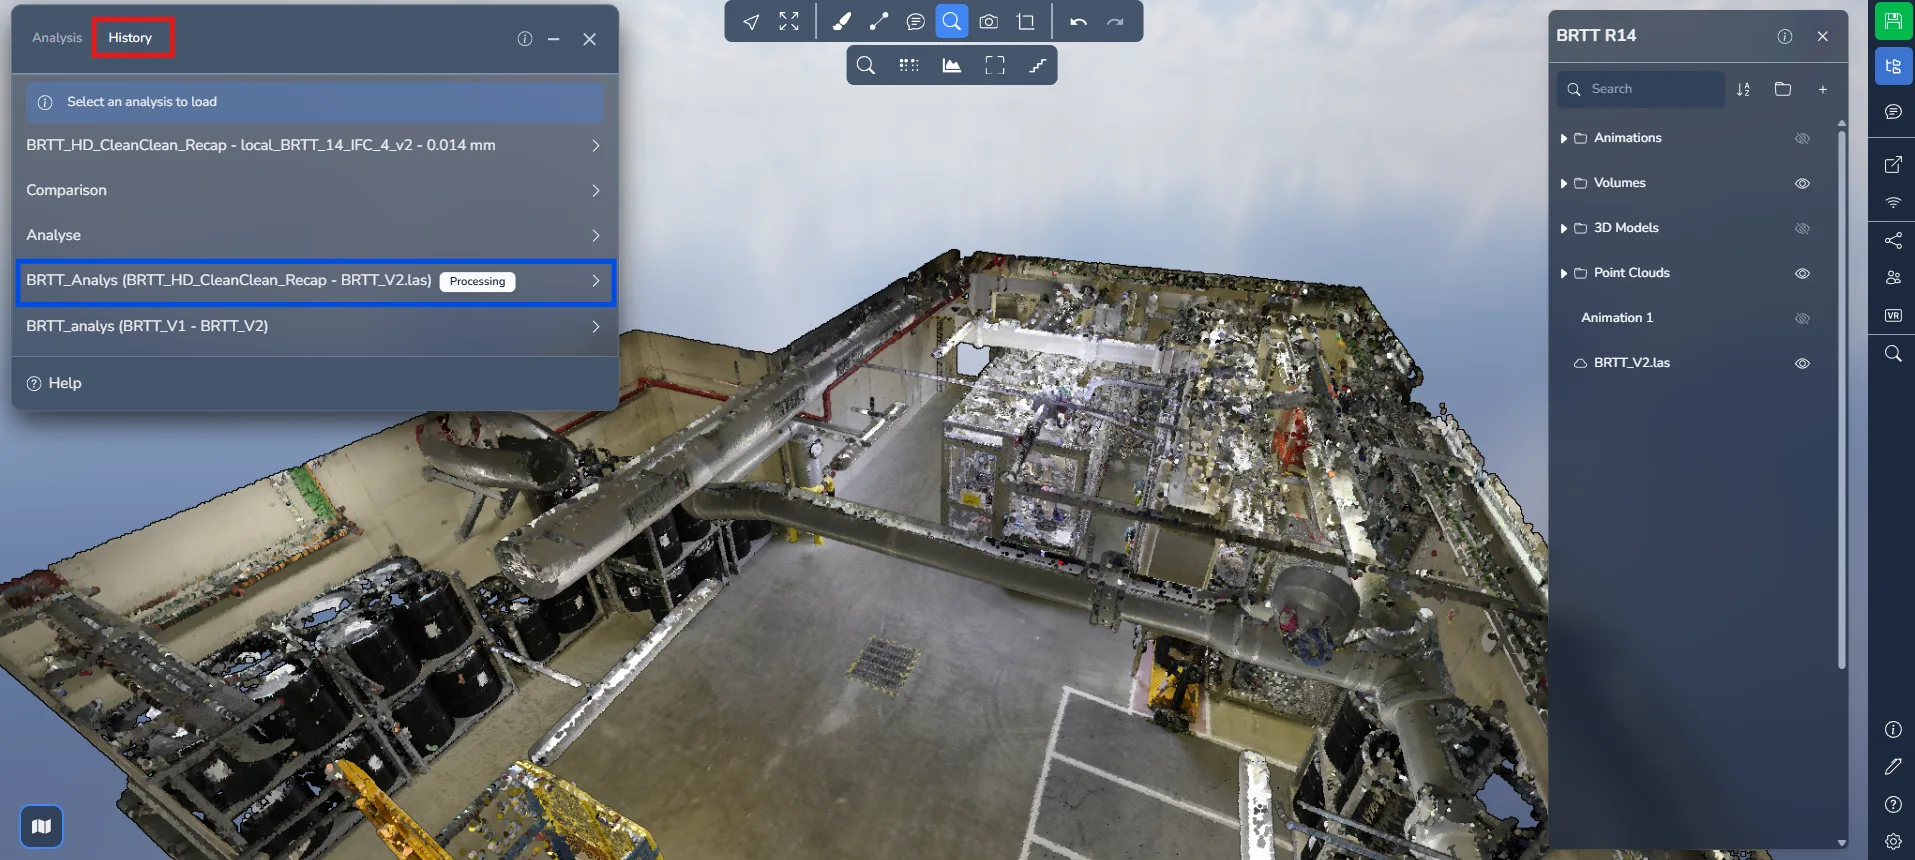
Monitoring the Analysis
To monitor the status of your comparison, navigate to the "History" tab.
Here, you will find a record of all comparisons performed within the project. While processing, the status will appear as processing.
Once the analysis is completed, you will receive an email notification. Return to the "History" tab and load your comparison to view the results.
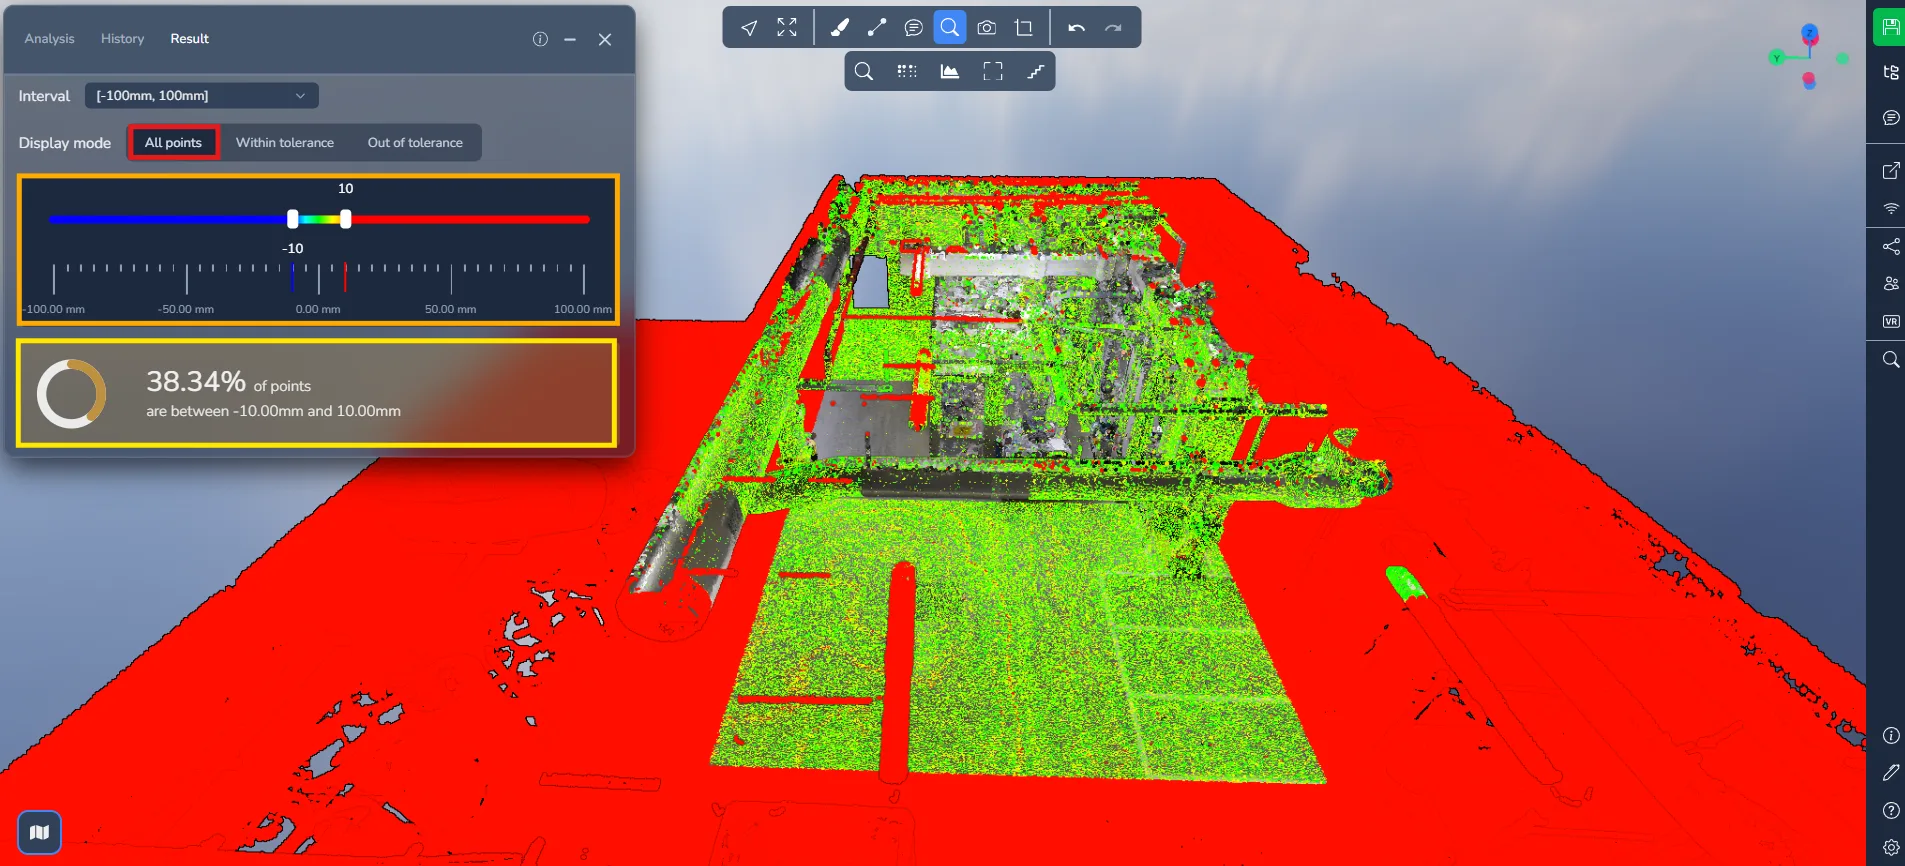
Understanding the Results
When the comparison is loaded, you will see a color gradient ranging from red to blue.
gradient ranging represents the distance deviation between the two point clouds:
-
Red: Large deviation between the two point clouds
-
Green: Close alignment (minimal deviation)
-
Blue: Negative deviation (points located inside the reference surface)
Yellow, orange, and cyan tones represent intermediate deviation levels
This visual feedback allows you to quickly identify areas where the two scans differ.
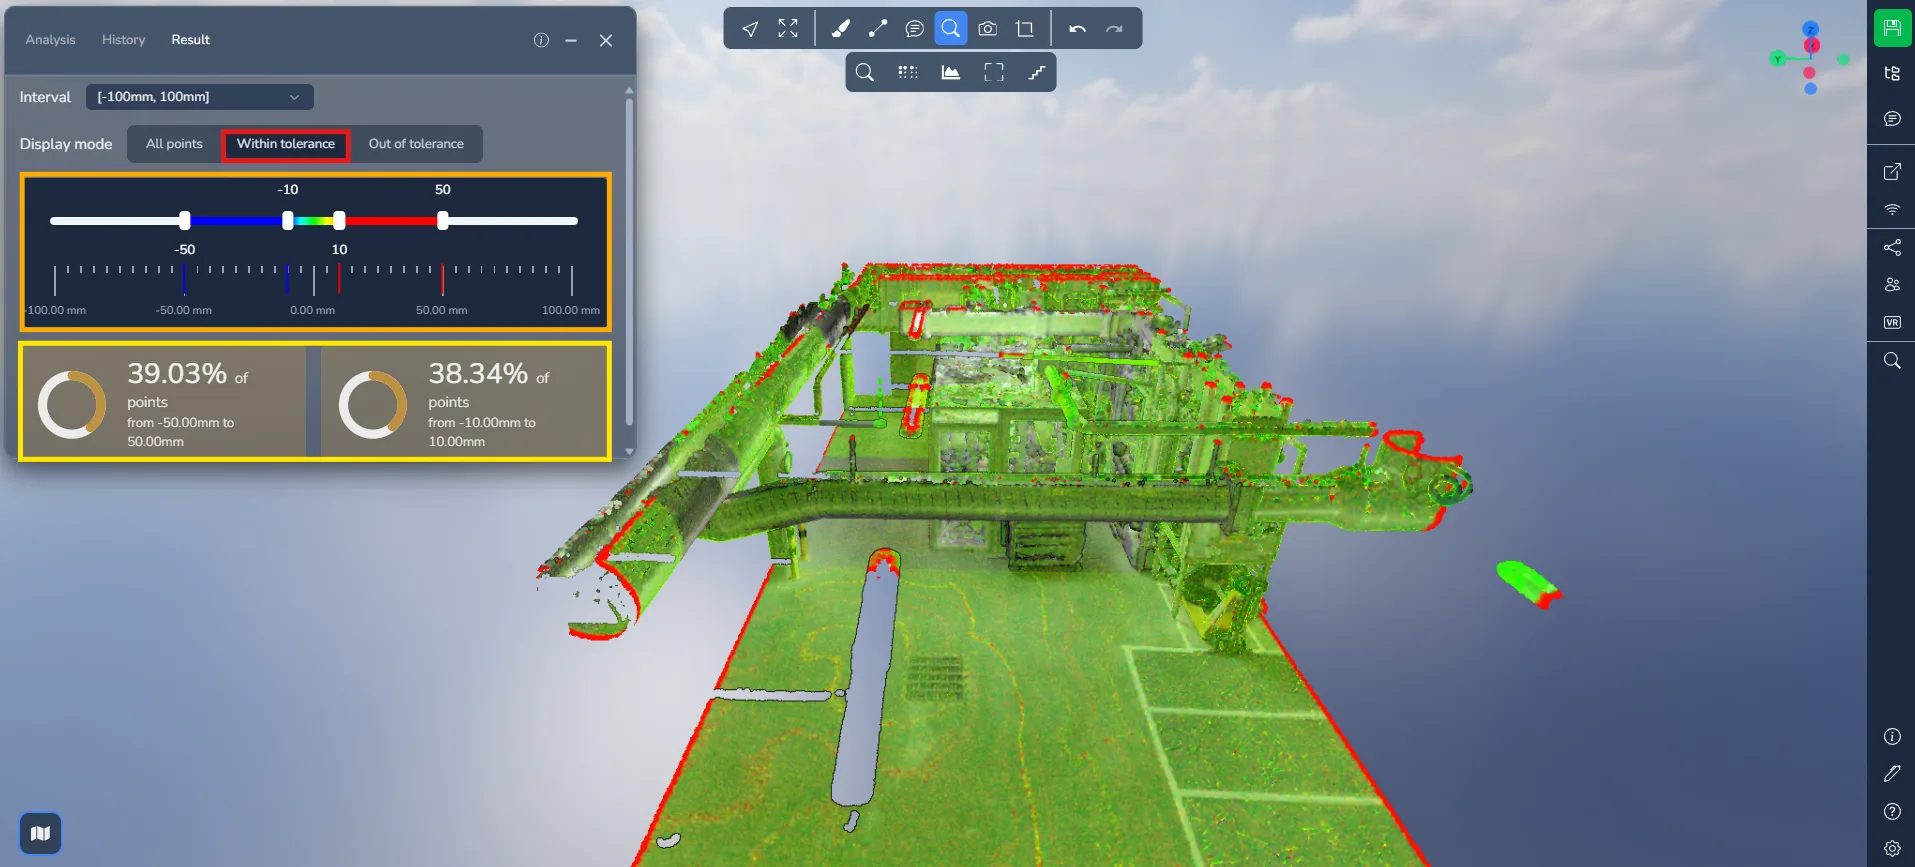
In the second mode, Within tolerance only the portions of the point cloud that fall within the defined tolerance range.
The slider now includes four handles :
-
The outer handles define the visible range
-
The inner handles define the default color gradient range
Two validation percentages are displayed, corresponding to the two tolerance thresholds.
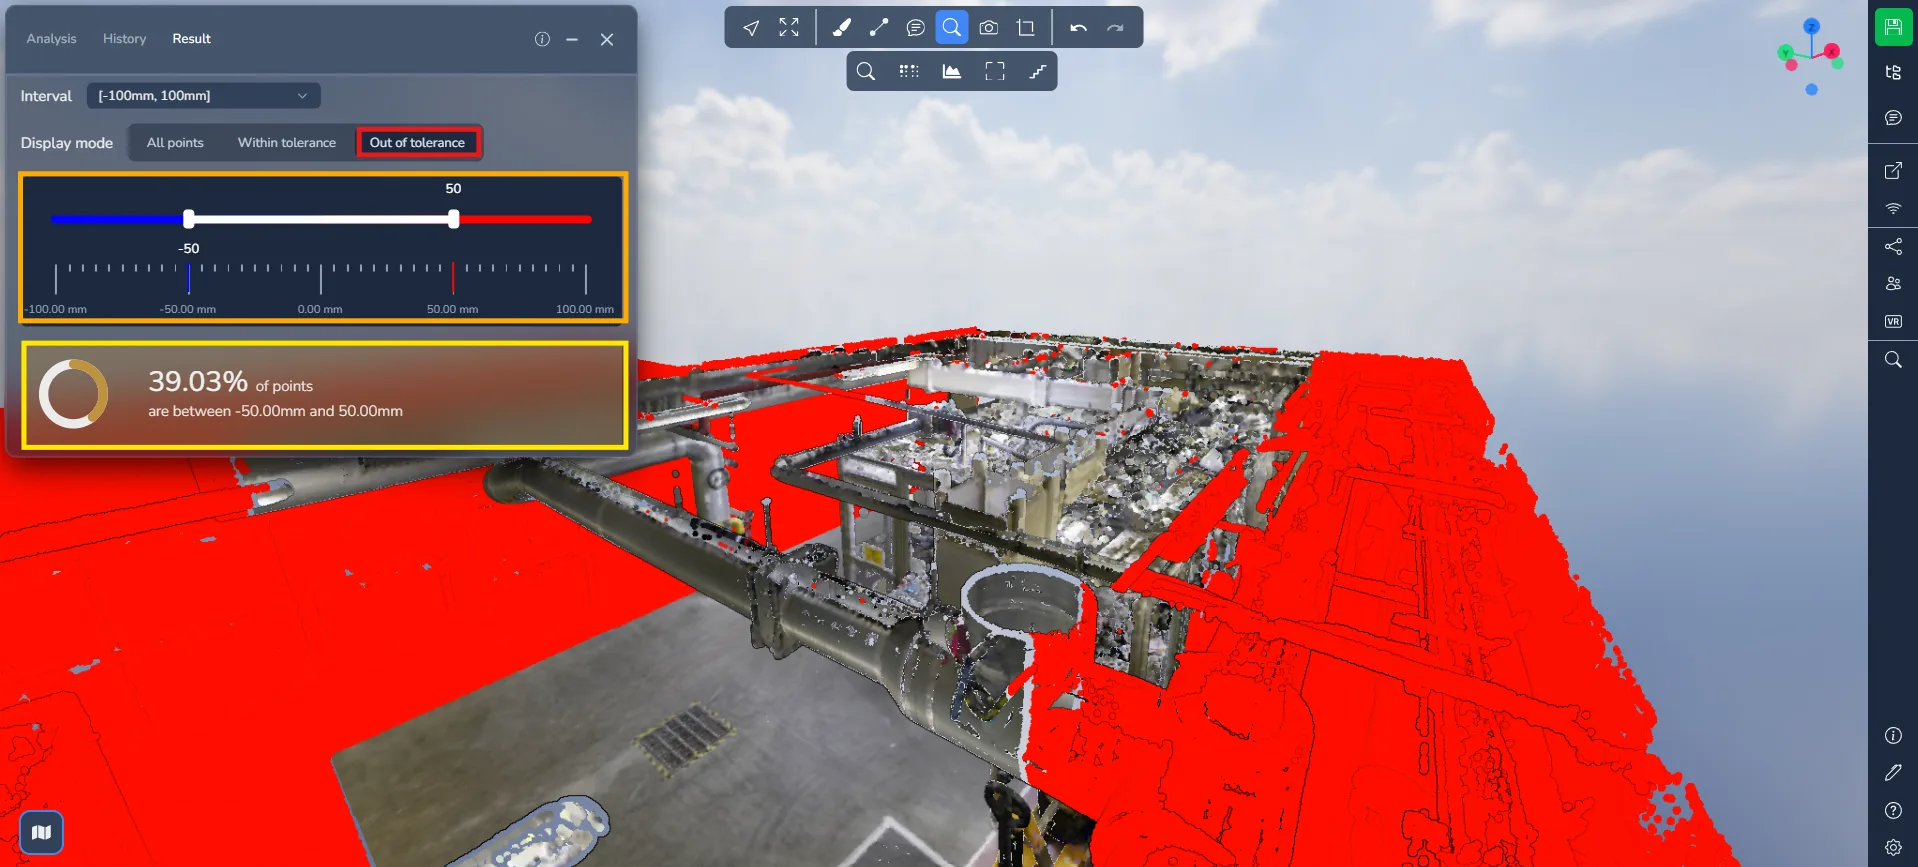
In the final mode, Outside tolerance only the areas where deviations exceed the defined tolerance.
The color gradient disappears, leaving only the most significant differences visible (typically red and blue).
This mode is especially useful for:
-
Detecting structural displacement
-
Identifying missing or added elements
-
Spotting scanning inconsistencies
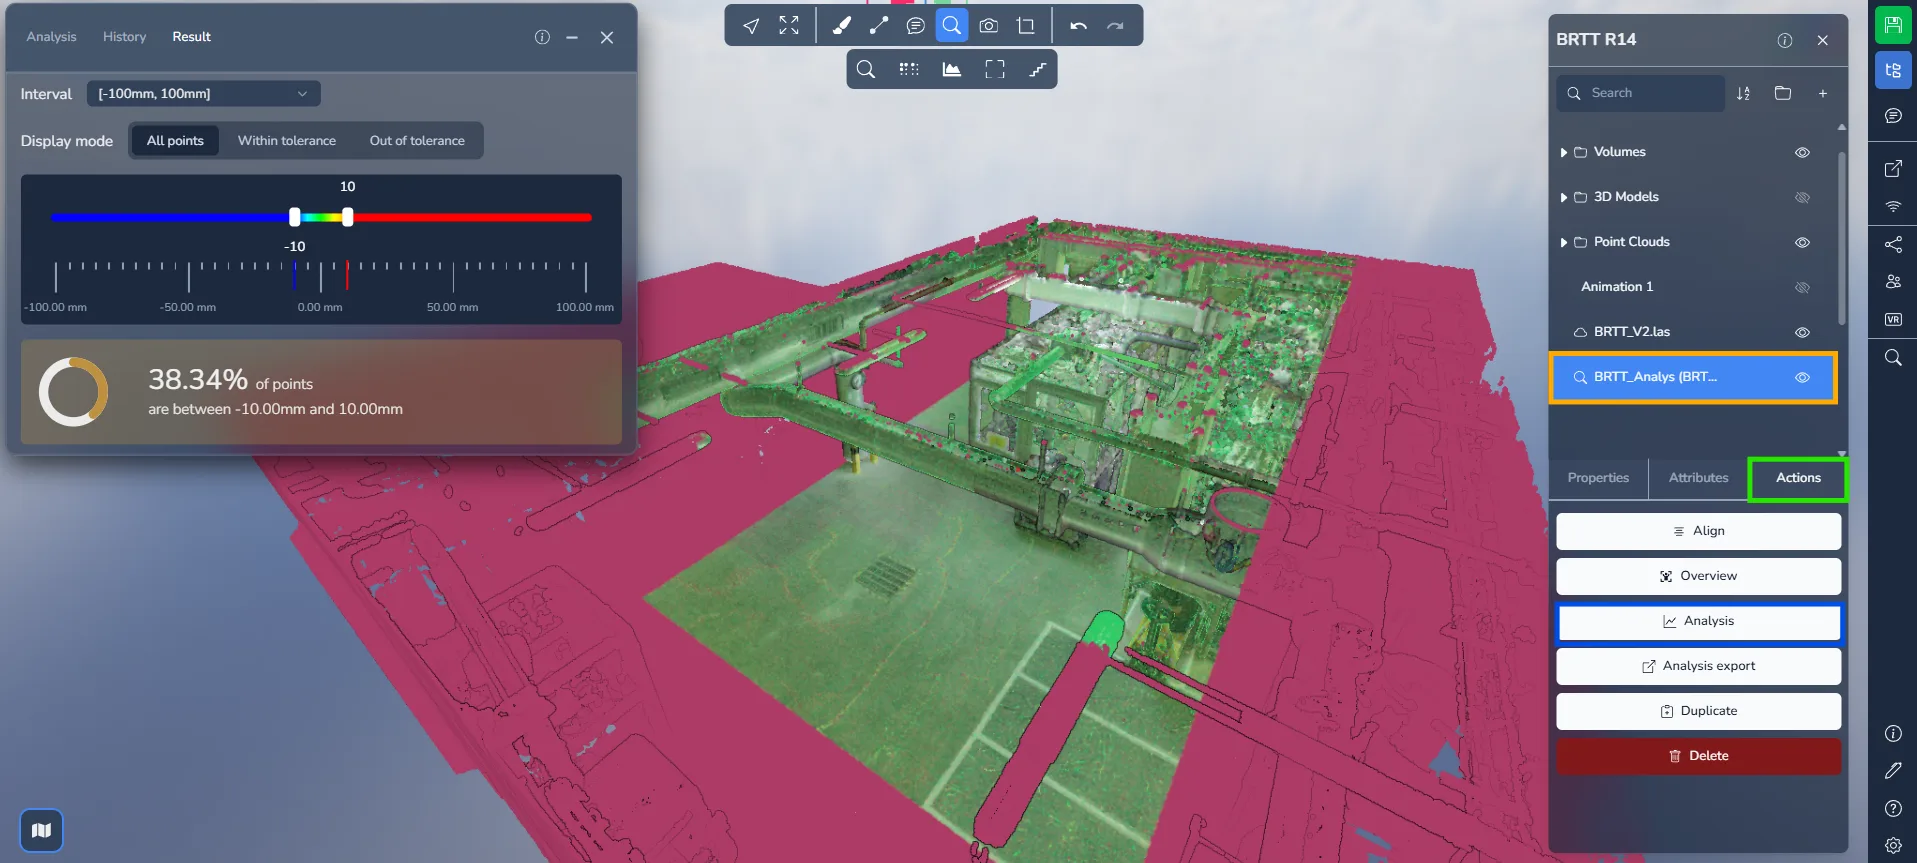
Reopening an existing analysis
After leaving and returning to the project, your comparison will be listed among the project elements.
Click on the comparison, then navigate to the "Actions" tab and select "Analysis" to directly reopen the rendered results.
If you run into any issues, our support team is here to help. Happy exploring !